|
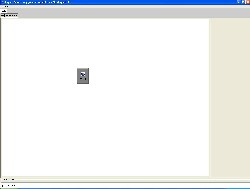
There will first of all be serveral levels to the given map. You will be able to doubleclick on one icon and it will bring up the submap for that given icon. We will start with a world view being the farthest you can zoom out. If something on a given submap looses connectivity the item at the farthest zoomed out level will turn a color to indicate that JavaNMS has lost connectivity to a device at a lower level.
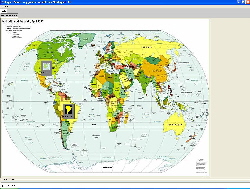
You will then be able to double click into that node and the application will grab the info for the next map off of the database including the background location. The next level looks like that on the left.
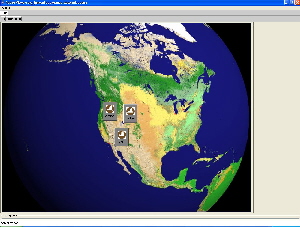
You can now see the different continents and each country has its own icon. If you double click into a continent you will get the next level of the map. As shown on the right.
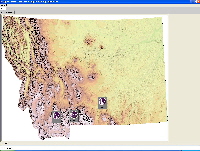
This will then show all of the different regions on that continent with a generic symbol for a state or providence. You can then double click on a state and it will bring you to the map for that given state like on the left.
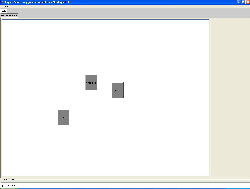
In the state view it will show all the different cities in that state. You can then double click on the cities and get all the clients and distribution sites in a given city and then you can also click into each site and get information like circuit ids and how the customer at that location is connected.
General Notes: Some general notes about this application. We are designing it to be very flexable. It is very easy to modify the database to your liking without having to deal with much of how the graph is displayed.
Also the graph will refresh automatically every set period of time. The first user to open the map will have read write privelages if their profile allows it and all other user will have read only privelages.
The background it set for each window/graph pane a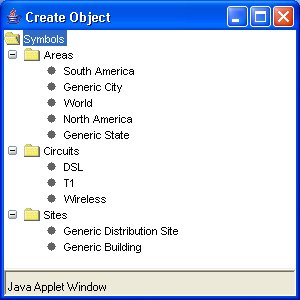 nd is changeable during runtime. nd is changeable during runtime.
It is also possible to add new nodes to the graph during runtime using the interface shown on the left and it opens a form for entering the information for a given node and then puts the newly added nodes in the holding area at the bottom of the screen until you drag them onto the graph. The database is automatically updated when the node is dropped onto the graph.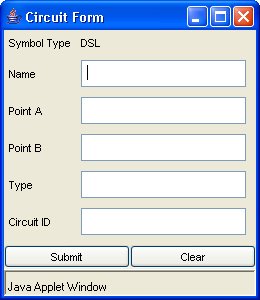
NOTE: These images are not what the final version will be. I have just gotten these to use in the meantime. If any of these images for either the cells or the backgrounds are yours and you do not approve of us using them in our project please e-mail me and I will take them off. Thank you.
|